Charts
Personalize user experience with charts in your web funnels
The Charts component allows you to visualize results and personalize user experience.
Try charts out in the example funnel https://try.fnlfx.com/charts
Chart type and settings
- Add the Chart component from the main list of components by clicking + Add
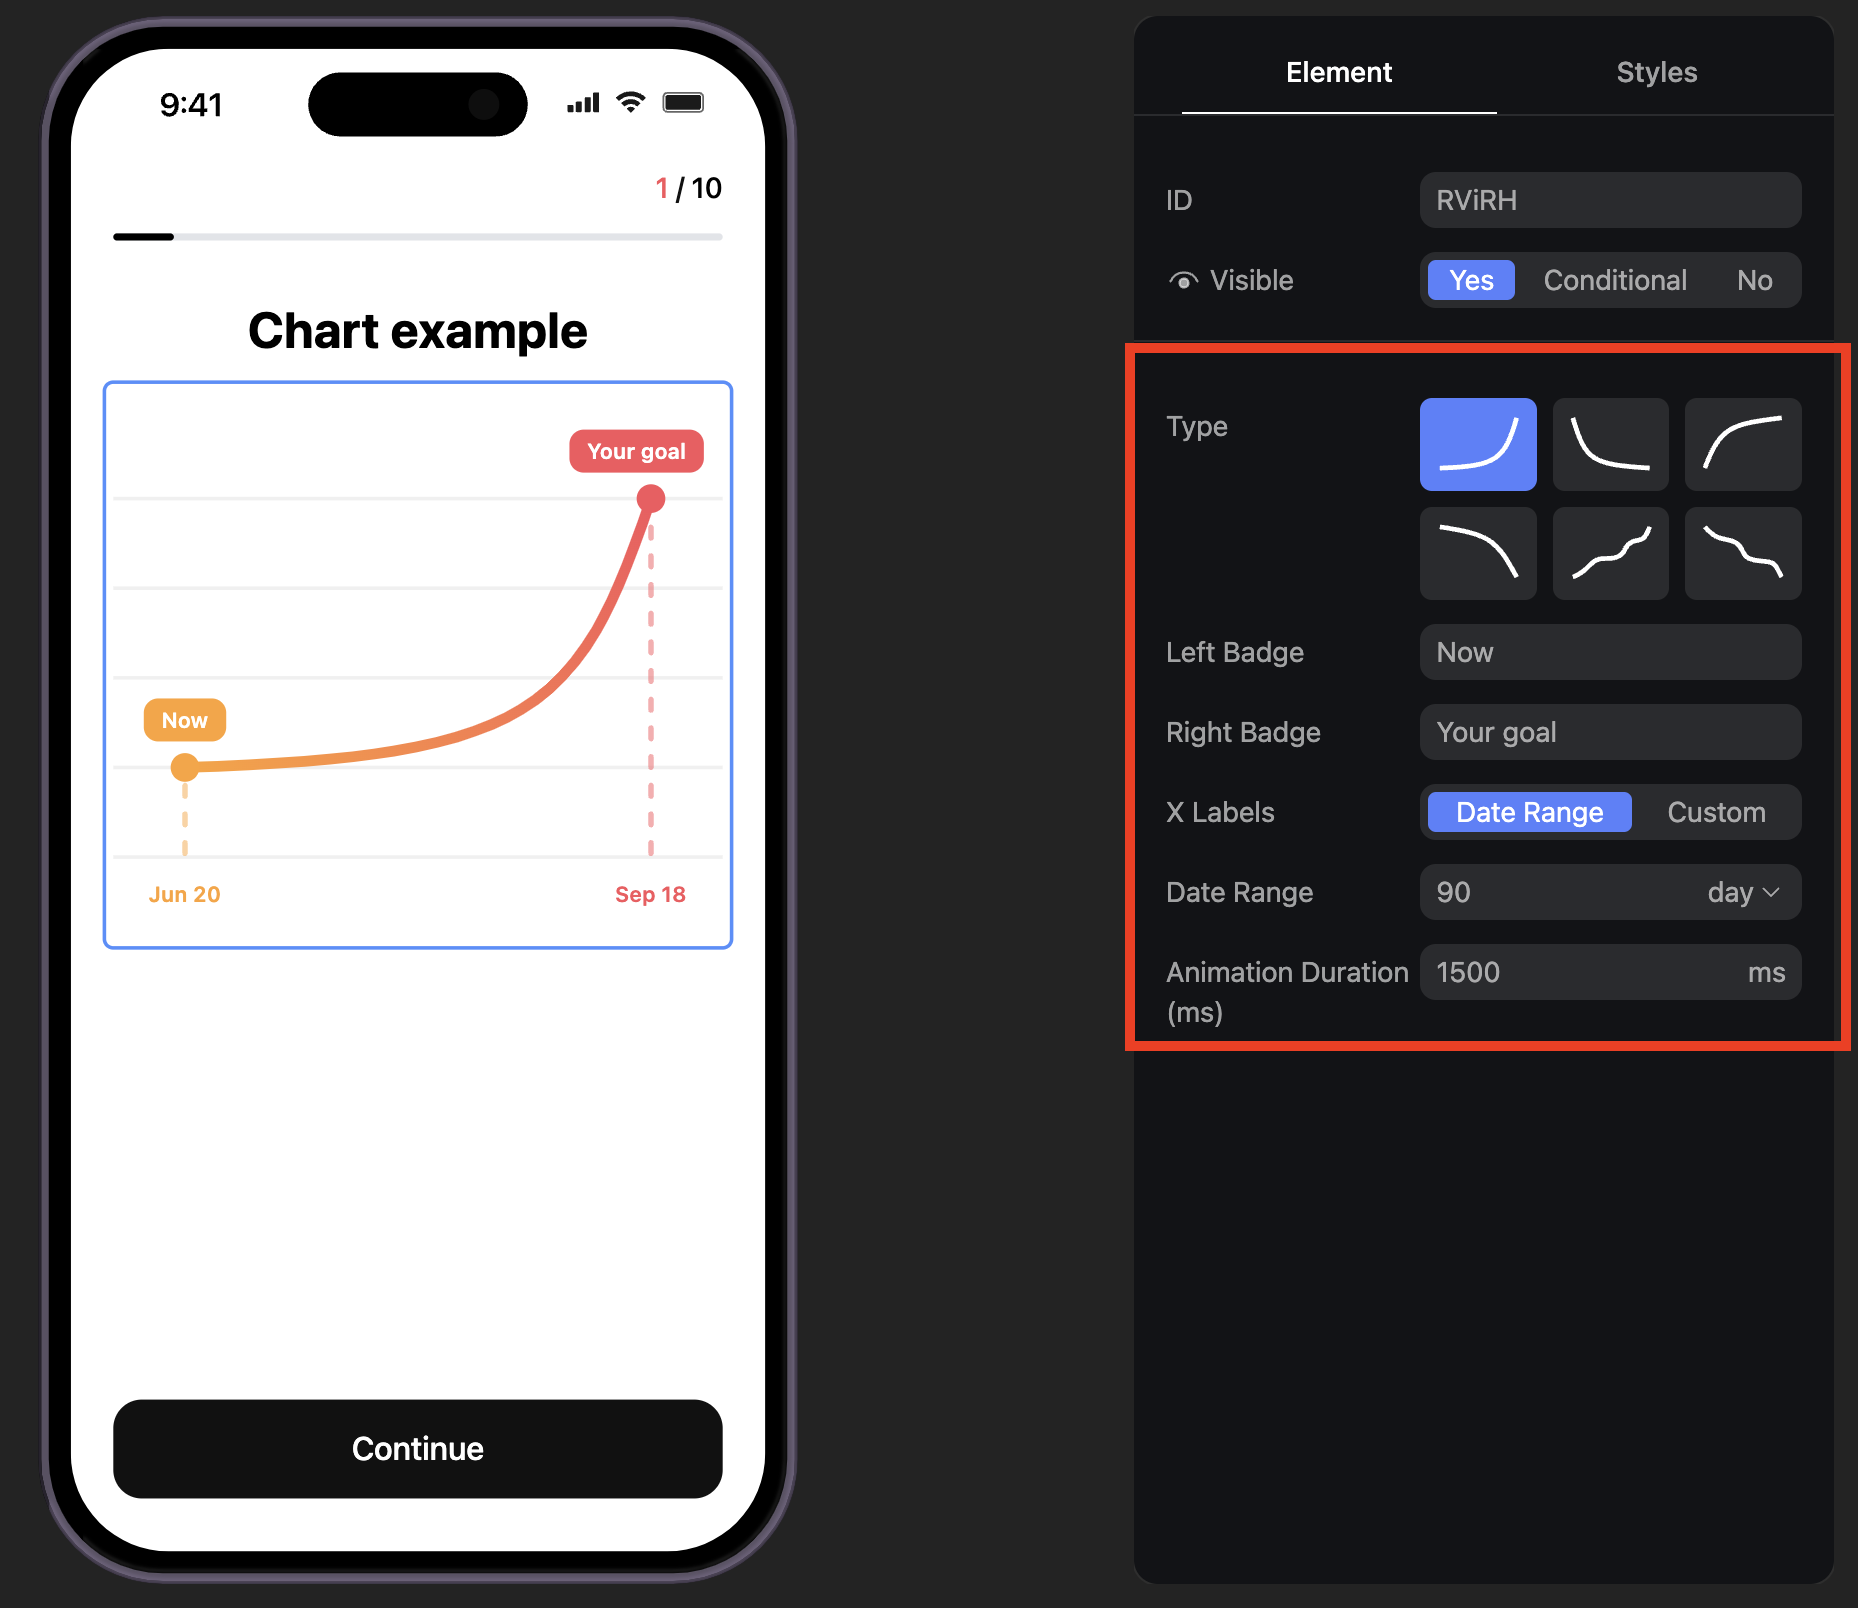
- Choose different types of curves. It doesn't connect with values.
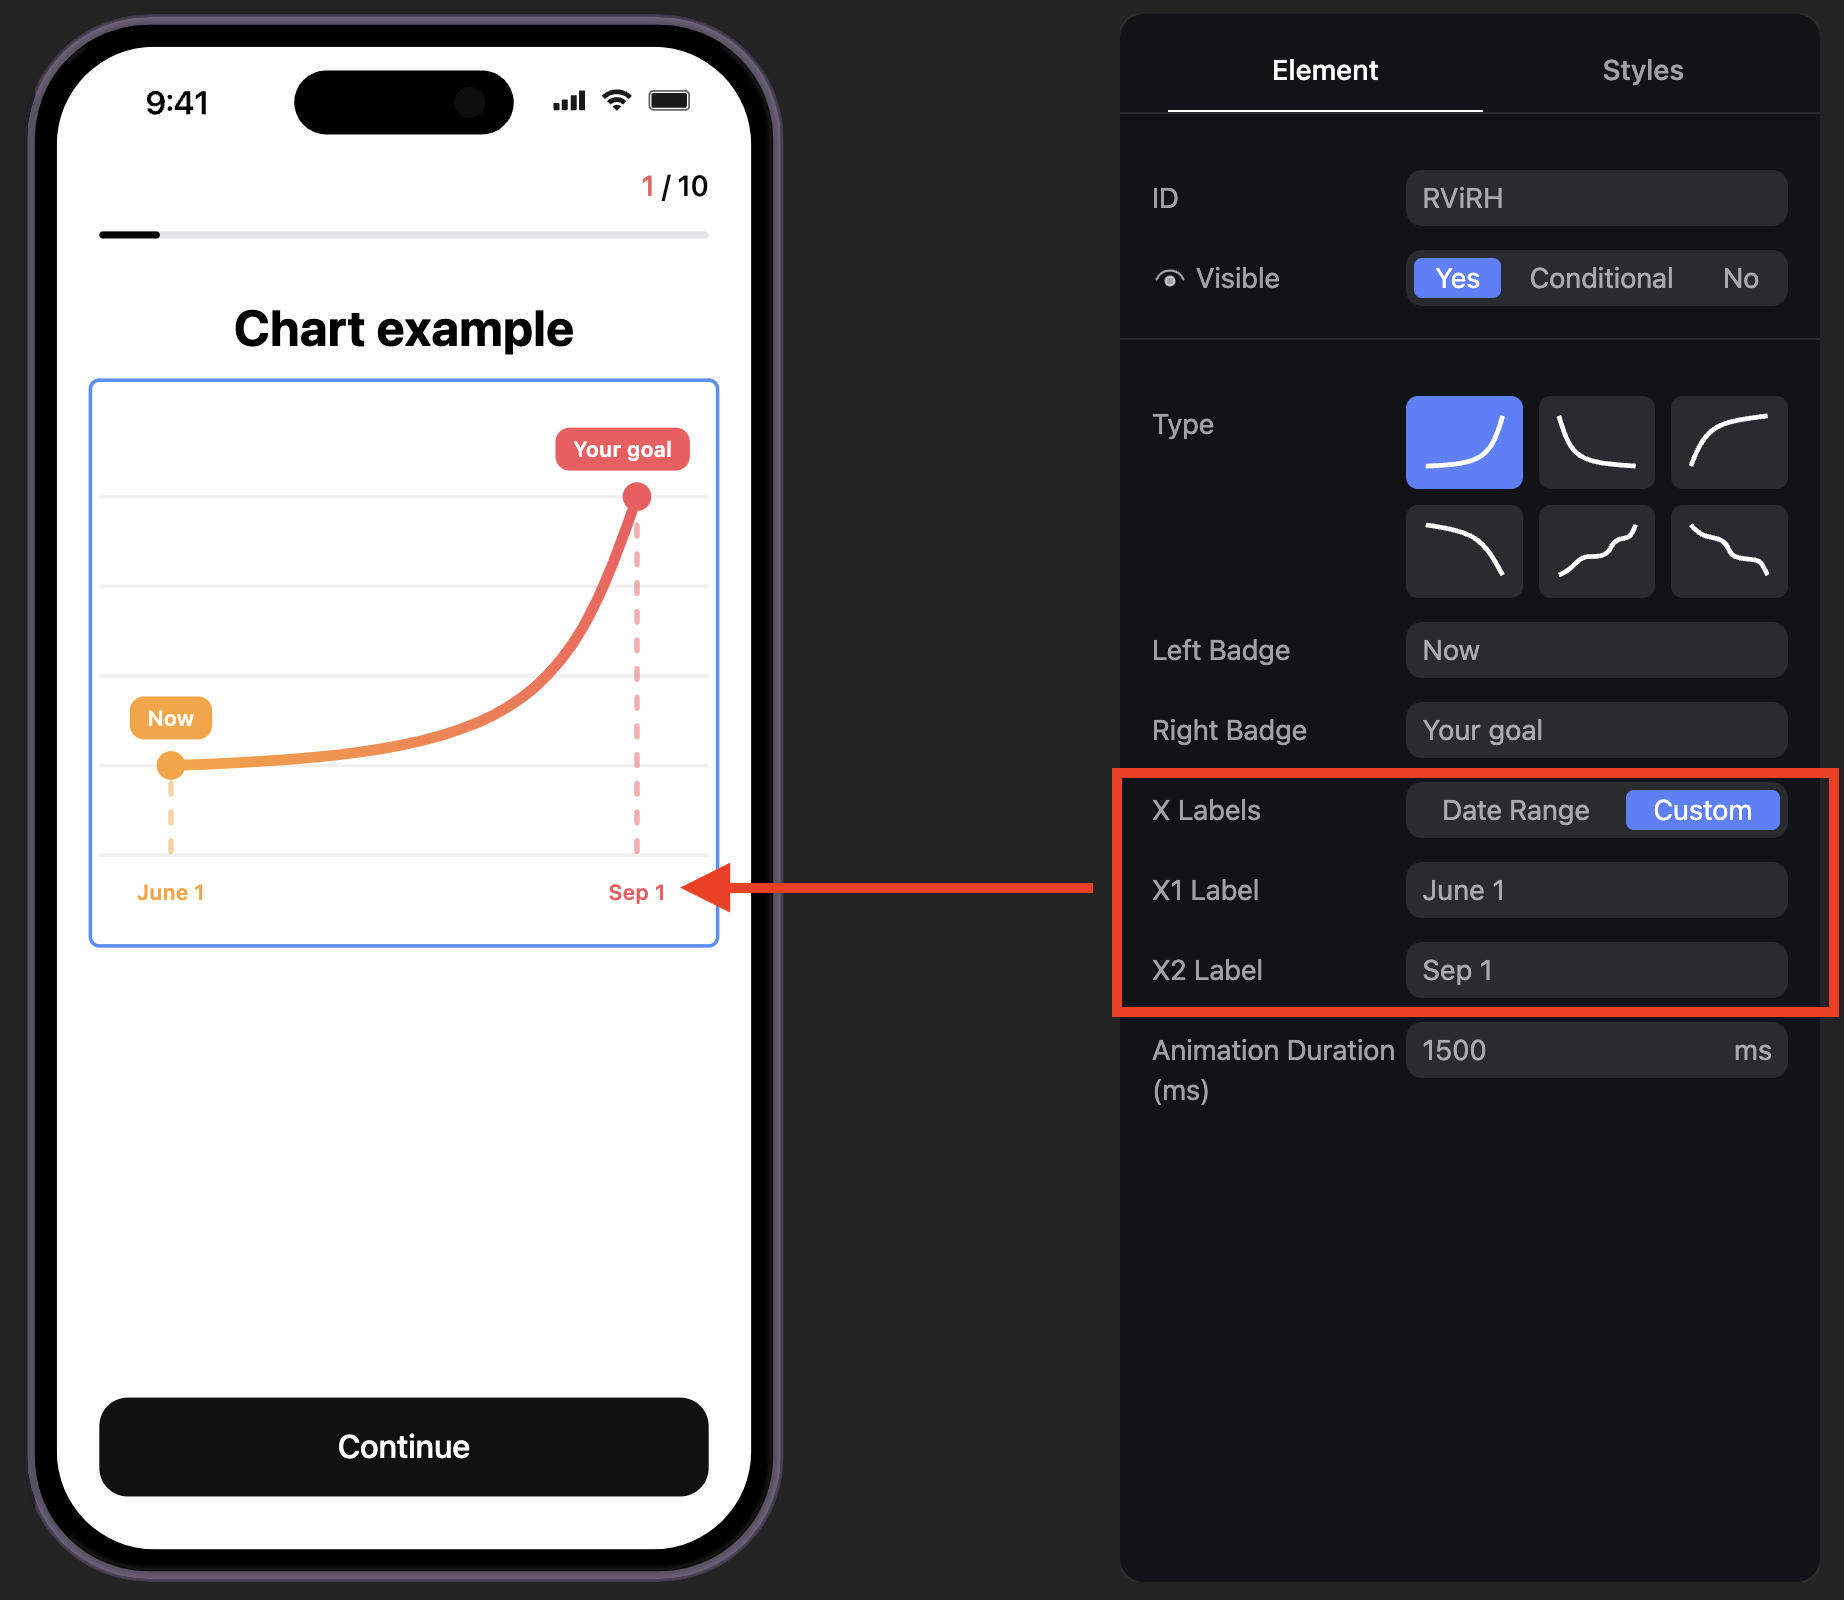
- By default X axis shows dates. You can configure the date range or specify custom values.
- Configure animation duration.
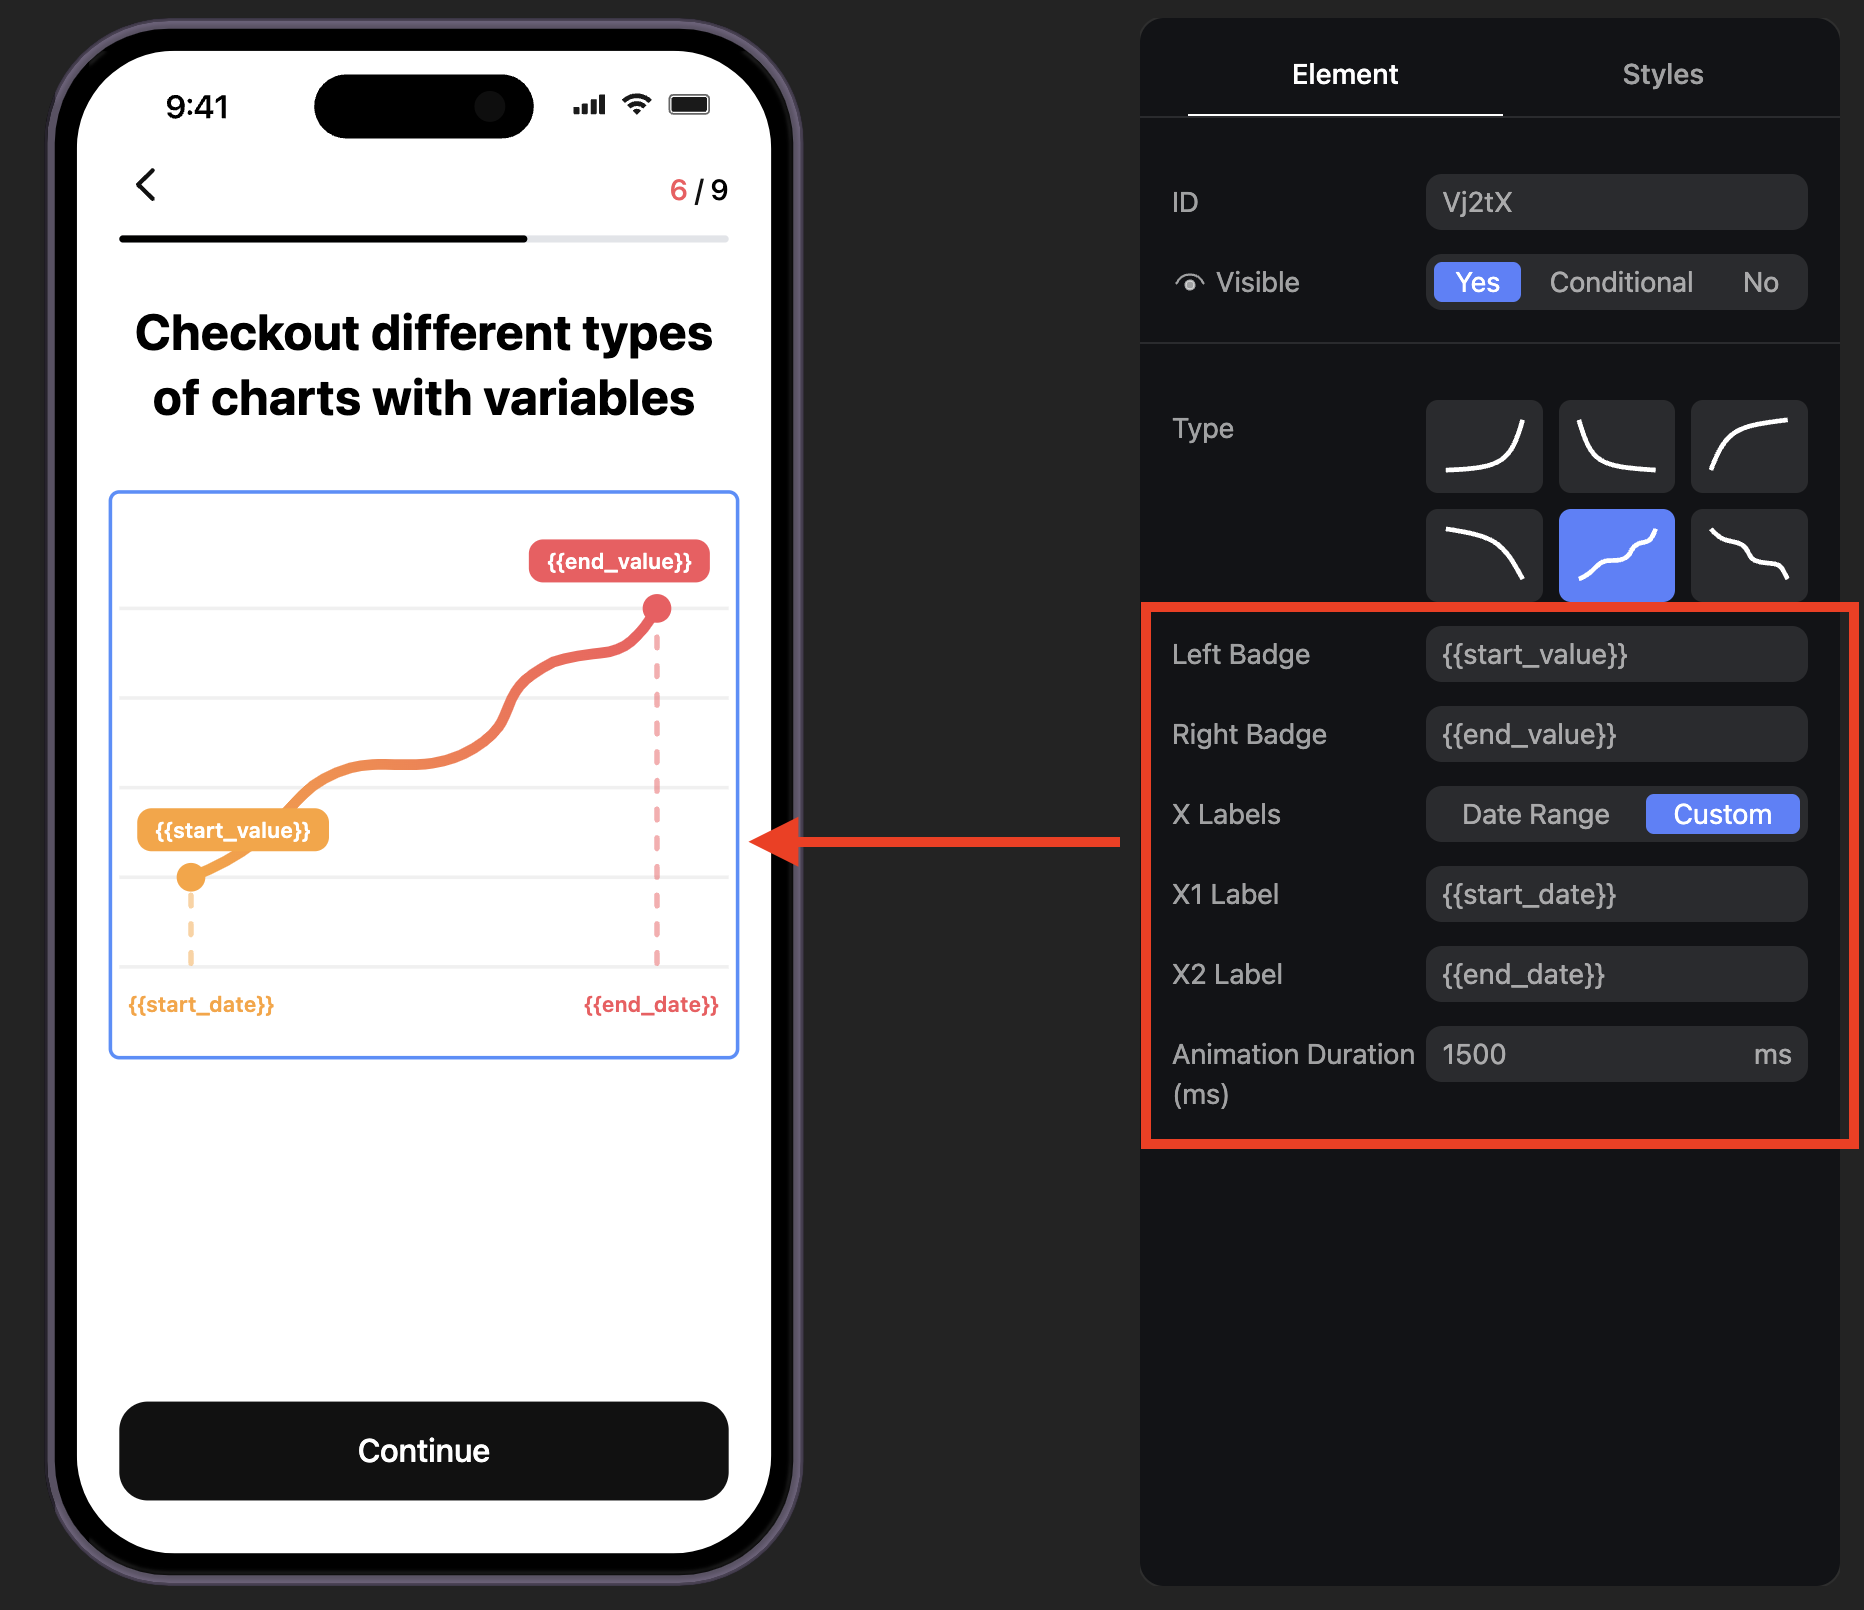
Charts with dynamic values
You can use {{variables}} in the chart settings.
Updated 5 months ago